
CHAMPAIGN, Ill. — A new data-driven dashboard produced by the Cline Center for Advanced Social Research at the University of Illinois Urbana-Champaign uses predictive modeling to pinpoint U.S. counties that have unusually high or low numbers of police use of lethal force incidents relative to national benchmarks.
The Cline Center’s SPOTLITE project has compiled nearly a decade’s worth of data identifying police uses of lethal force across the U.S., making it the most comprehensive nationwide record available. It documents any law enforcement discharge of a firearm that risks human life, regardless of whether anyone was killed or injured, as well as any pursuit or other use of force that results in a civilian death.
SPOTLITE’s new “anomaly detector” feature will highlight parts of the country that may be in need of reform — or that might already be doing innovative things to reduce unnecessary uses of lethal force by police, said Scott Althaus, the Merriam Professor of political science at Illinois and the director of the Cline Center.
People are also reading…
“SPOTLITE’s anomaly detector is the first national-scale resource for directing attention to counties with unusual numbers of lethal force incidents by police,” he said. “Up until now, there wasn’t a way to identify outliers, high or low, at a national scale. With the mountain of aggregated data our team has compiled through SPOTLITE, that’s enabled our researchers to do some modeling that can predict how many incidents we should expect to see in any given county.”
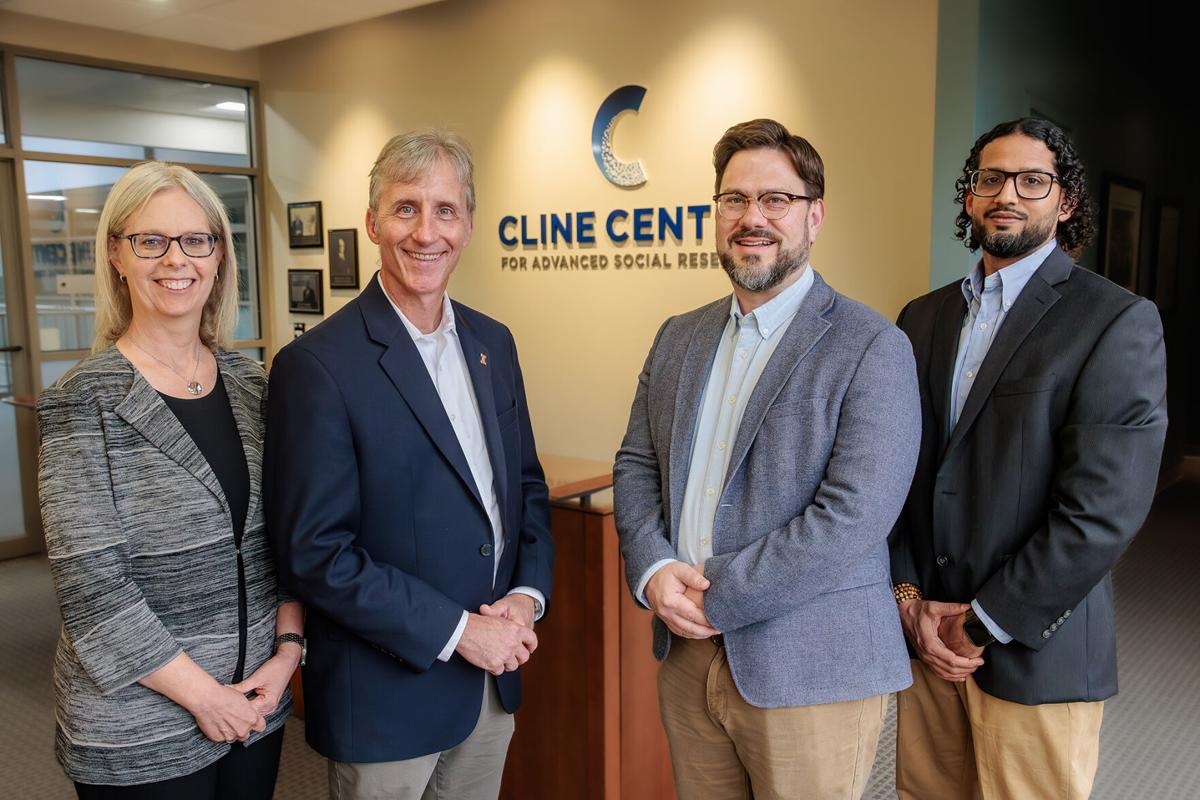
The interdisciplinary team of scholars and experts guiding the SPOTLITE project includes Althaus; Joseph Bajjalieh, a senior research manager at the Cline Center; Jay Jennings, the assistant director of research and a research scientist at the Cline Center; Michael Martin, a senior research coordinator at the Cline Center; Jennifer K. Robbennolt, the Alice Curtis Campbell Professor of Law at Illinois; Ajay Singh, the assistant director of strategic research initiatives and a research scientist at the Cline Center; and dozens of undergraduate and graduate student researchers who have worked since 2017 to compile the database.
SPOTLITE’s new anomaly detector was developed using national data from incidents that occurred across all 3,142 counties in the U.S. from 2014-2023.
“We created a statistical model that is generating these predictions by analyzing all of our SPOTLITE data from every county in the U.S.,” Jennings said. “It’s a predictive model that asks how many police shootings we should expect based on three variables: population size, population density and how much civilian gun violence is in a community. And then it takes that predicted number and compares it to what a county actually had, which generates a rate that we translate into categories – many more than predicted, somewhat more, about what was predicted, fewer than predicted, and many fewer than predicted.”
“What this anomaly detection system allows us to do is to identify among those 3,142 counties which ones have unusual rates of SPOTLITE incidents, and that’s meant to invite questions about what is going on in those places,” Althaus said. “Why are some seeing more of these incidents than predicted, and why are others seeing fewer?”
Whether it’s a high anomaly or a low anomaly county, the researchers said no definitive insights can be drawn from the data alone.
“We don’t know if anomaly results are ‘good’ or ‘bad,’ per se,” Althaus said. “All we know is that unobserved factors beyond a county’s population size, population density and levels of civilian gun violence are contributing to the number of observed SPOTLITE incidents. What this system allows us to do is to zero in on the unusual places that we need to take a closer look at and learn from. Ultimately, we don’t draw any conclusions about what is going on in particular places based on these data. Our mission is to document everything and be a resource for the public.”
“We have a map where people can zero in and see the different rates, and you can see them by year, or you can see them averaged across time,” Jennings said. “That will give community members a better understanding of the trend, whether it’s been a steady increase or decrease, or perhaps there was one year that was an outlier, where something was happening in the community.”
The SPOTLITE project originated from calls for police accountability and reform in the aftermath of fatal police shootings involving unarmed Black citizens. Since its launch in 2022, the database has afforded communities throughout the U.S. access to data that supports evidence-based police reform — a pivotal first step in addressing long-standing concerns about racial inequities in policing and rebuilding trust between police and the communities they serve, Althaus said.
“The SPOTLITE project is nonadvocacy and nonpartisan,” Althaus said. “We don’t call for change or reform. Our role is to authoritatively document what is happening in ways that can benefit communities around the country — and now, to shine a light on counties that look anomalous. Ultimately, that will improve accountability between law enforcement agencies and the communities they serve.”
The anomaly detector of the SPOTLITE dashboard is available at https://clinecenter.illinois.edu/spotlite/anomaly-detector.